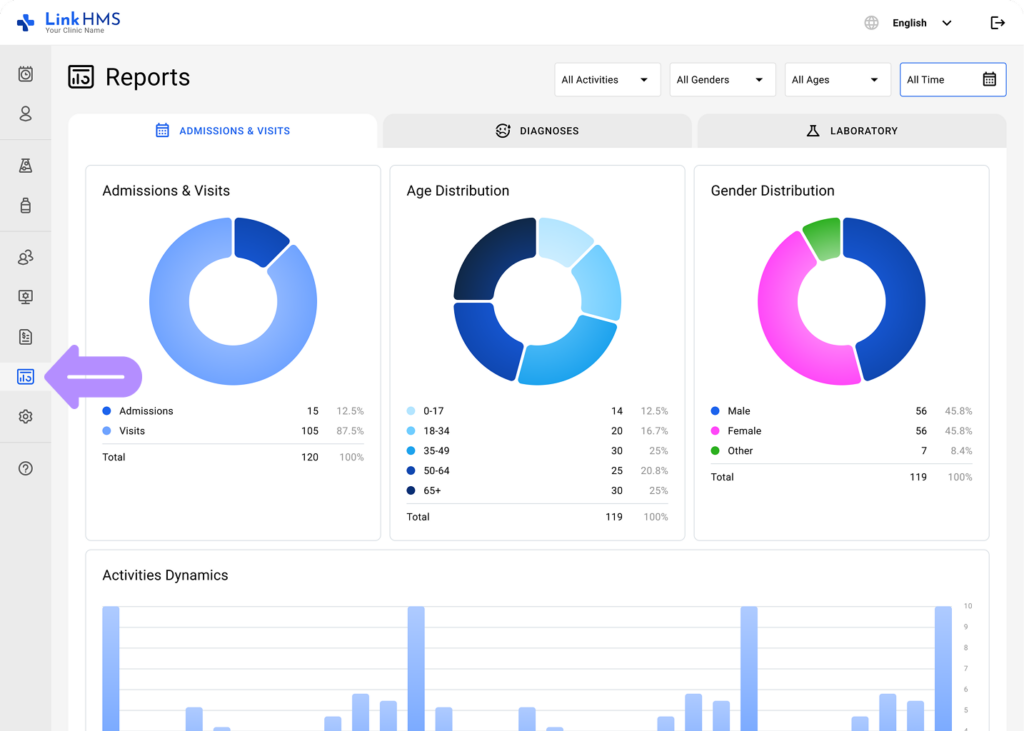
The Reports section provides a visual overview and helps you monitor trends and understand patient activities and demographics through interactive charts and reports.
Review the Reports on Admissions & Visits
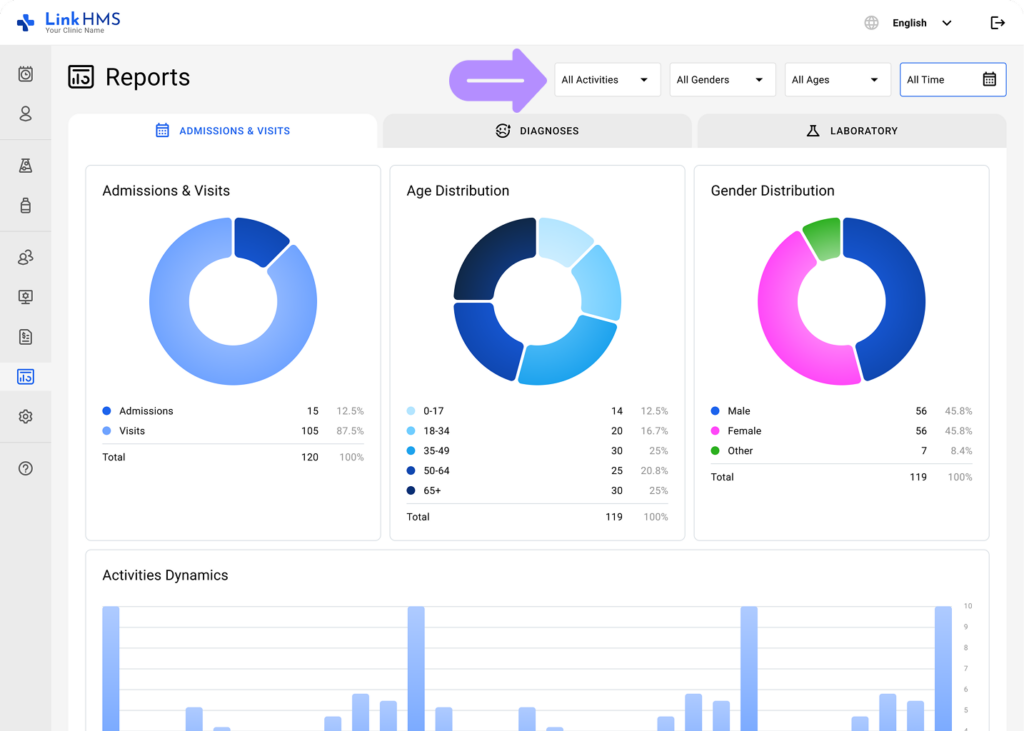
- Navigate to the Reports tab from the left-side menu and choose Operational Reports.
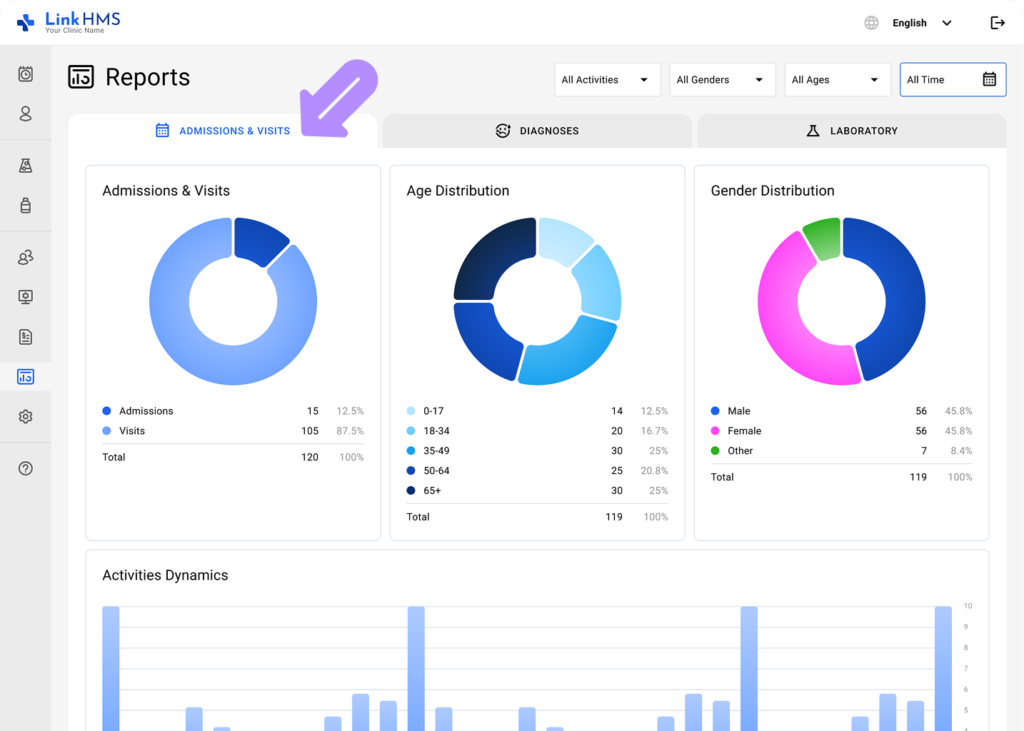
- Open the Admissions & Visits tab.
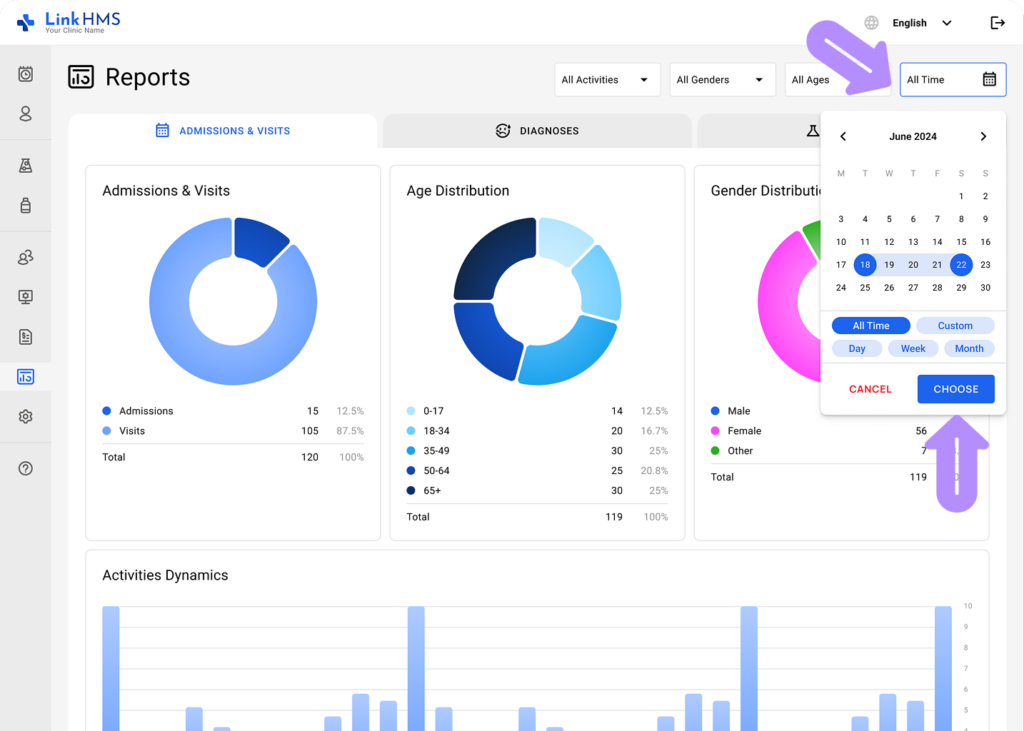
- Select a specific time range, or choose the All Time option to view all data.
- Specify the activity type (All Activities, Admission, Visit) to view the necessary Admissions & Visits distribution.
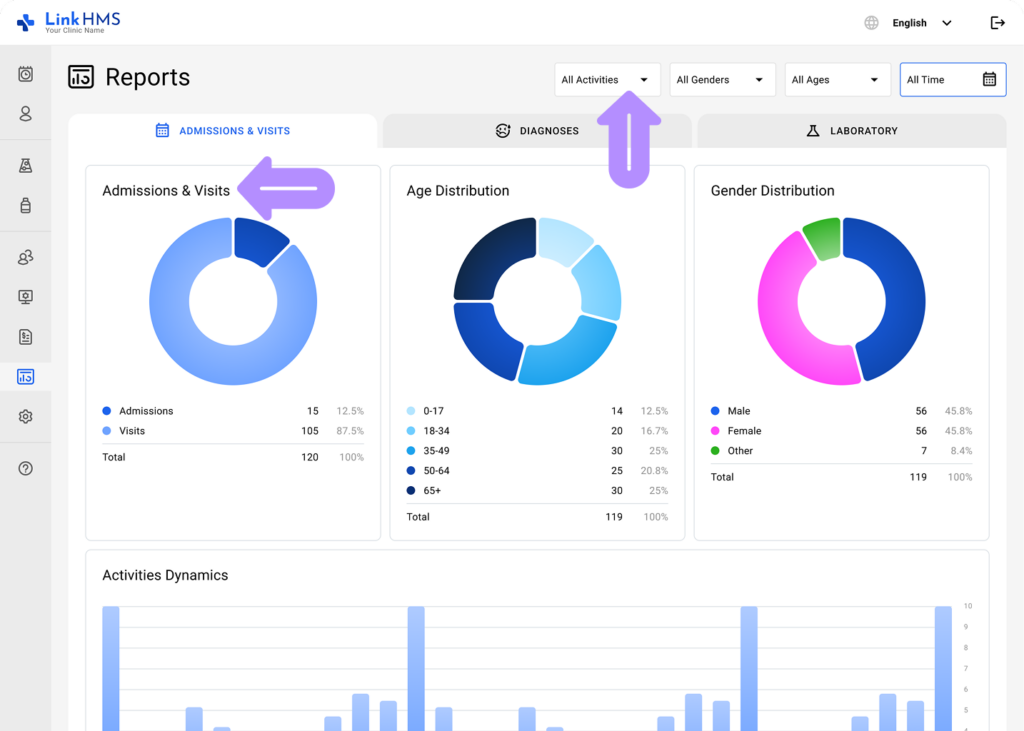
- Select the gender (All Genders, Male, Female, Other) to view the specific Gender distribution.
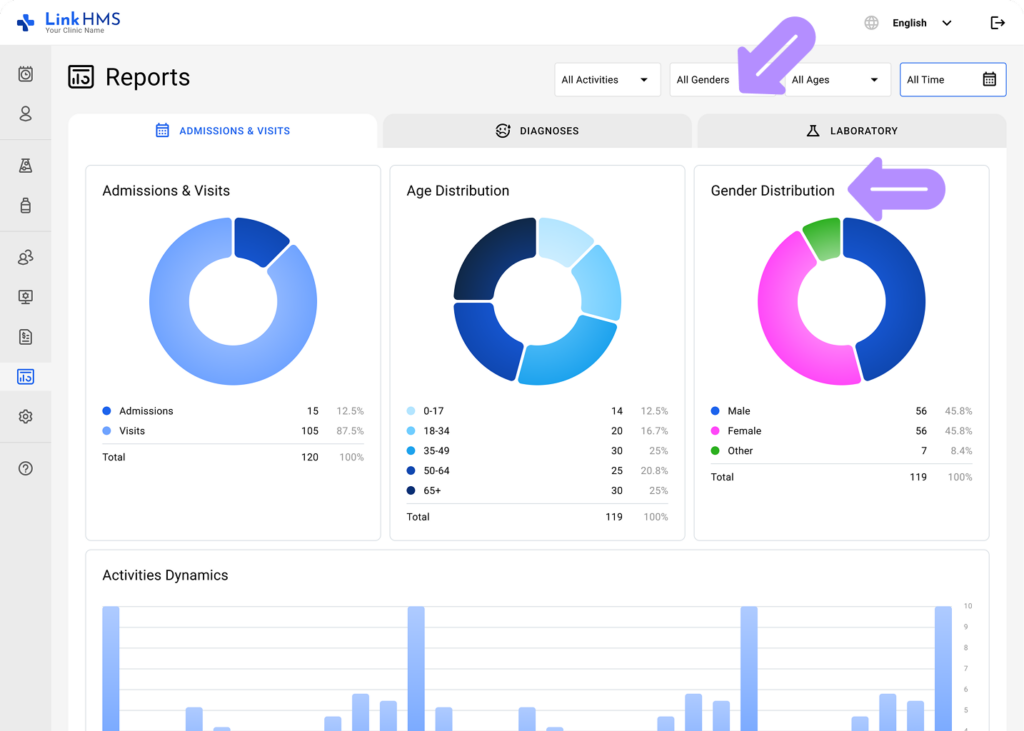
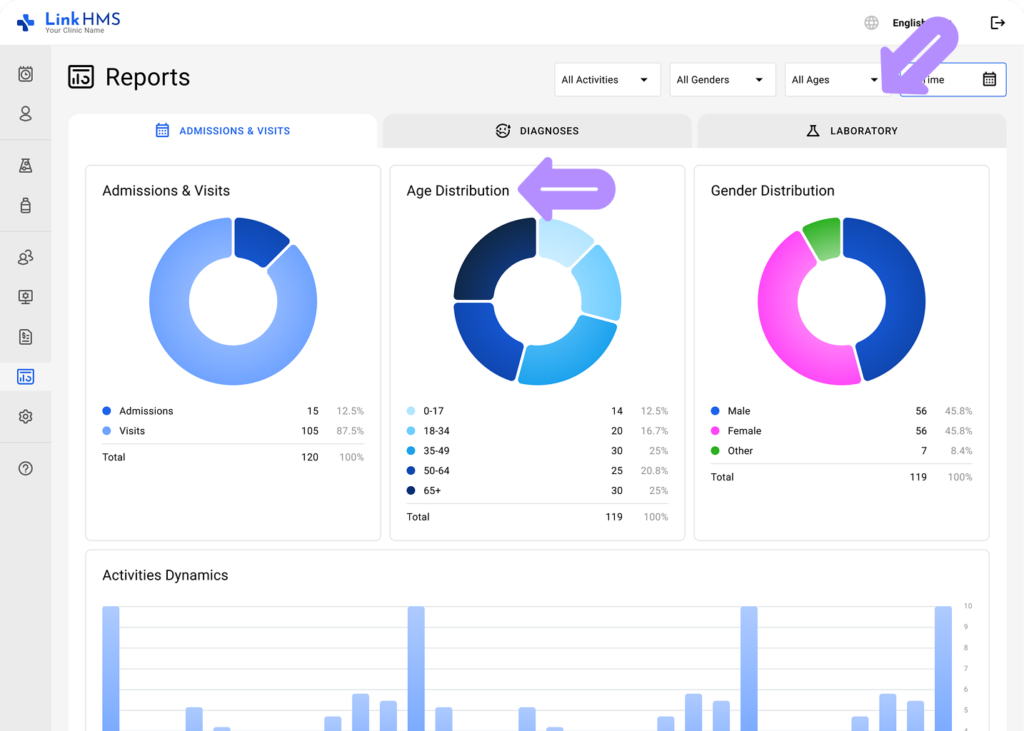
- Choose the age range (All Ages, 0-17, 18-34, 35-49, 50-64, 65+) to view the required Age distribution.
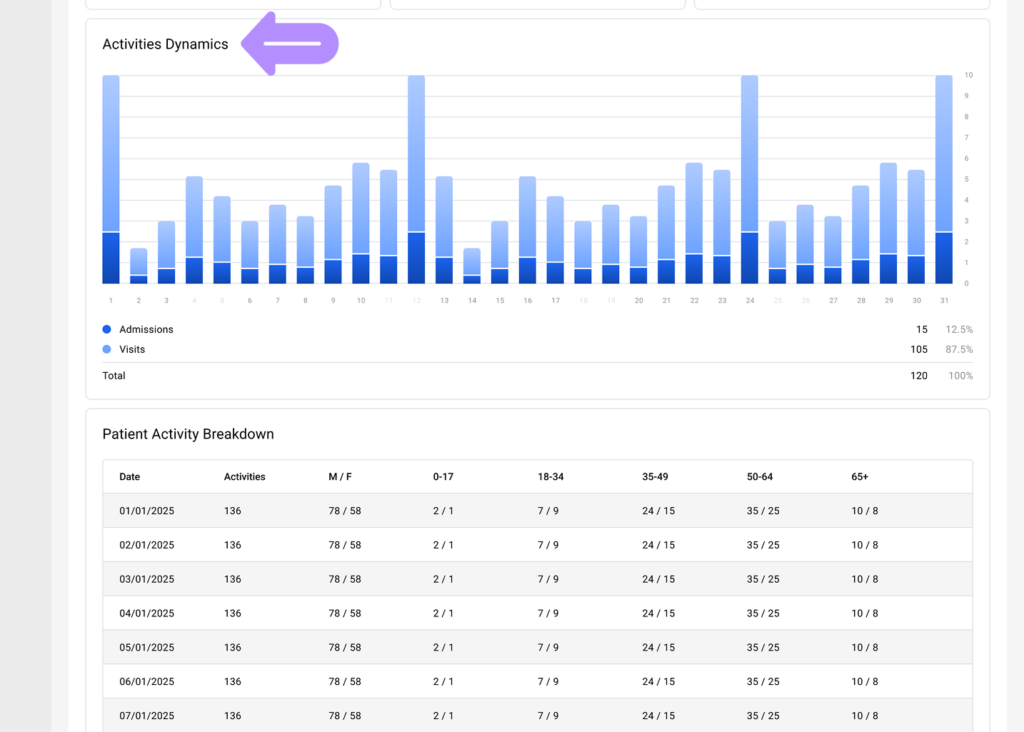
Overview Activities Dynamics
- Review how the clinic’s activities change over the specific period.
💡Notes
You can adjust the time range and other filters to focus on the metrics most relevant to your current request.
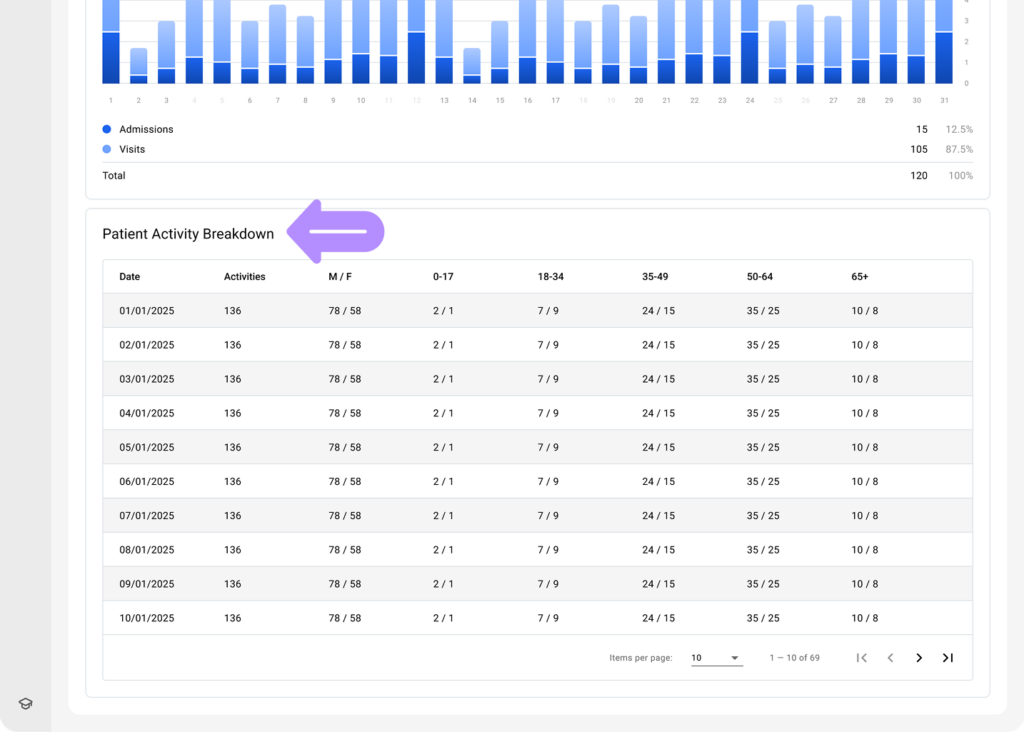
Check Patient Activity Breakdown
- View the number of activities and patients for the specific date, categorized by age range and gender.
The system automatically generates reports for a specific time period to monitor key trends and provide insights into patient demographics and activities.