The Revenue (Billed) tab provides a detailed view of all amounts to track total billed revenue and analyze trends over time.
Review Reports on Revenue (Billed)
- Open the Reports section from the left-side menu, then select Finance Reports.
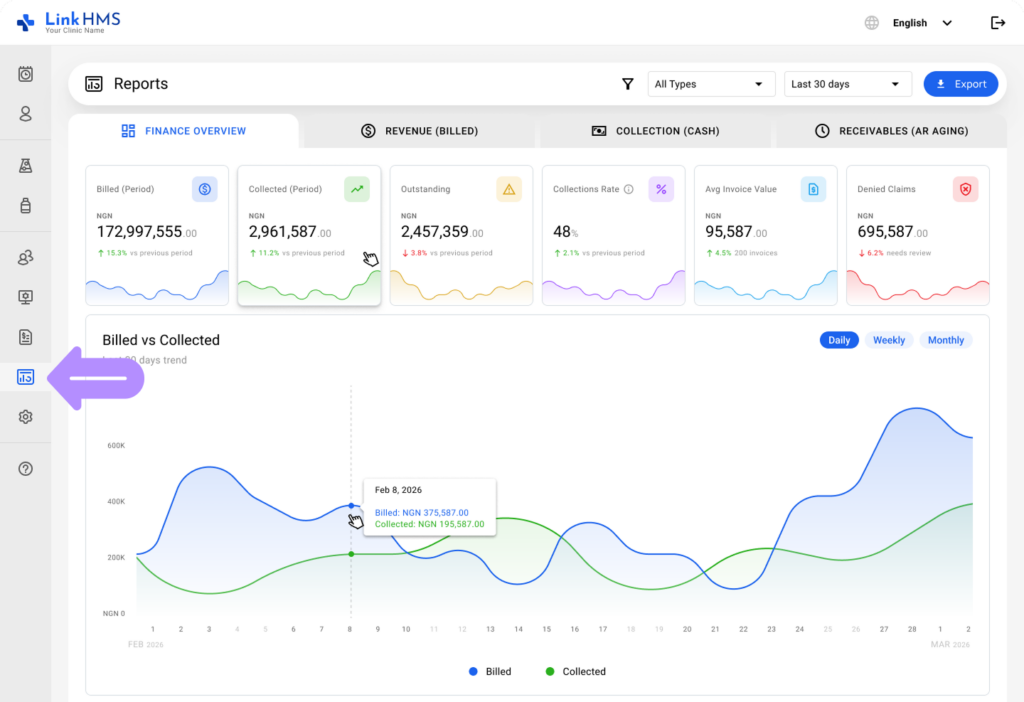
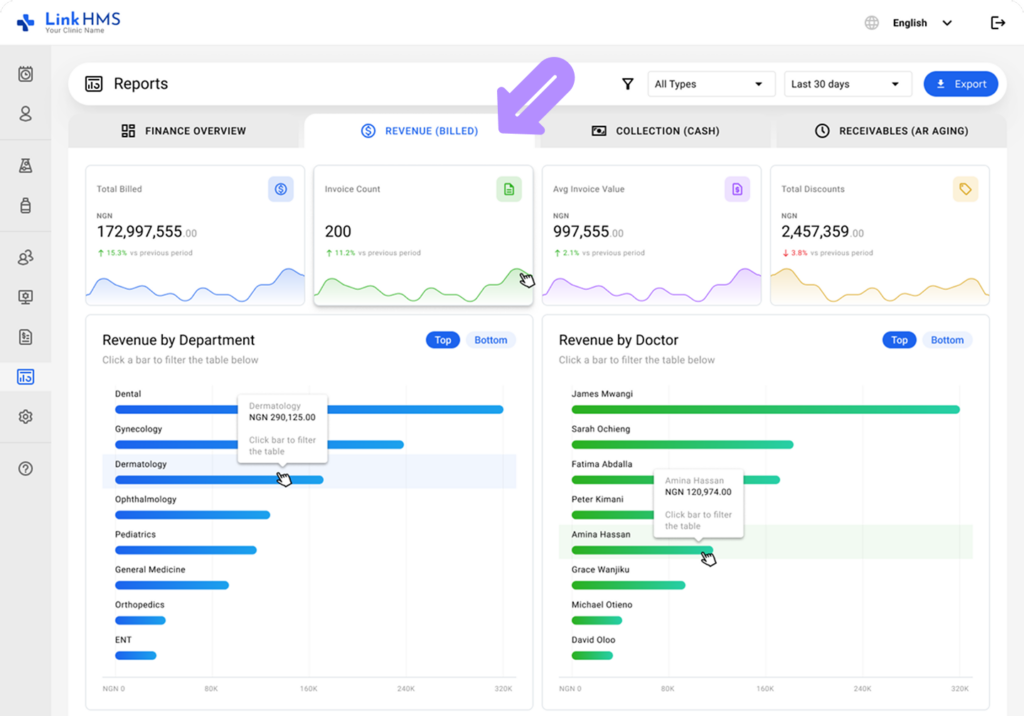
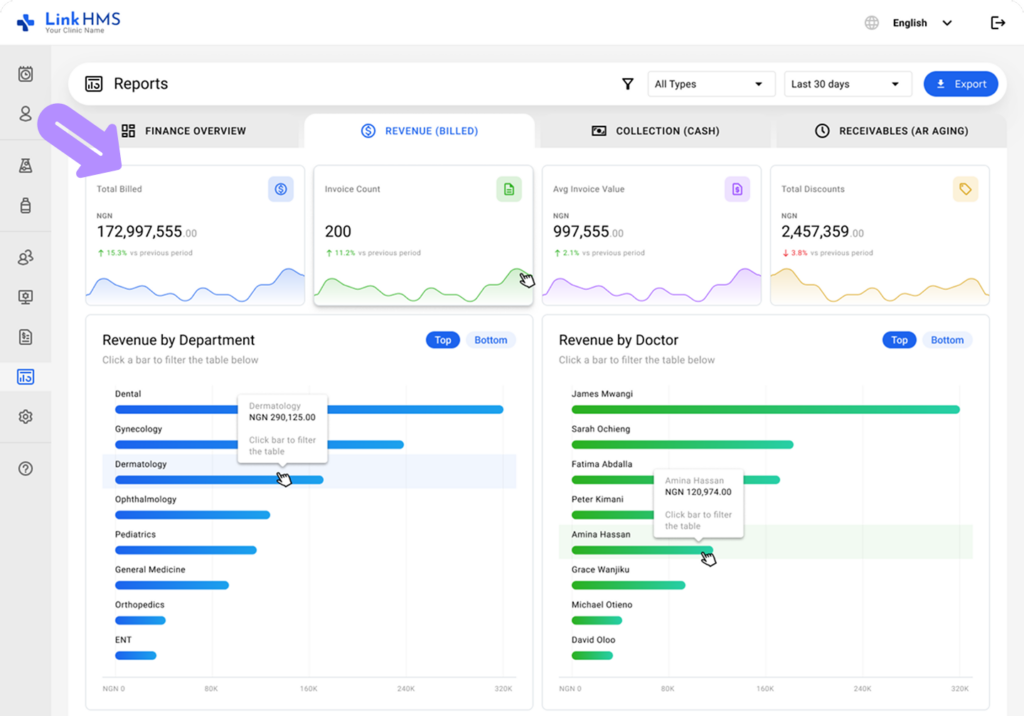
- Navigate to the Revenue (Billed) tab.
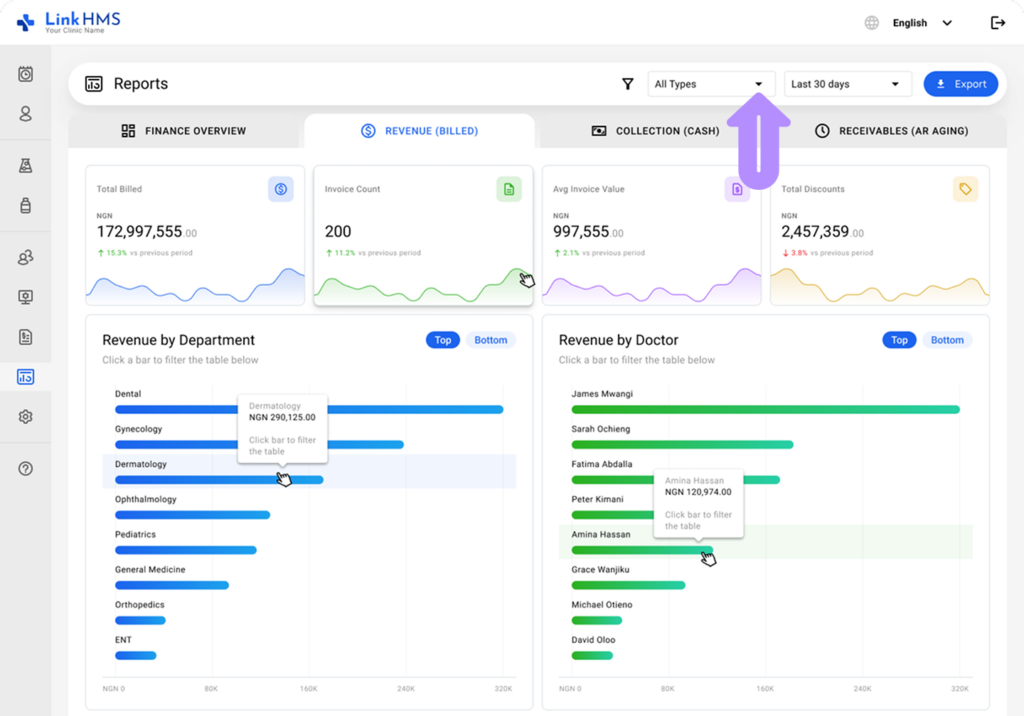
- Pick a specific time period (Today, Yesterday, Last 7 days, Last 30 days, Last 90 days, This month, Last Month, This Year) to display all available data.
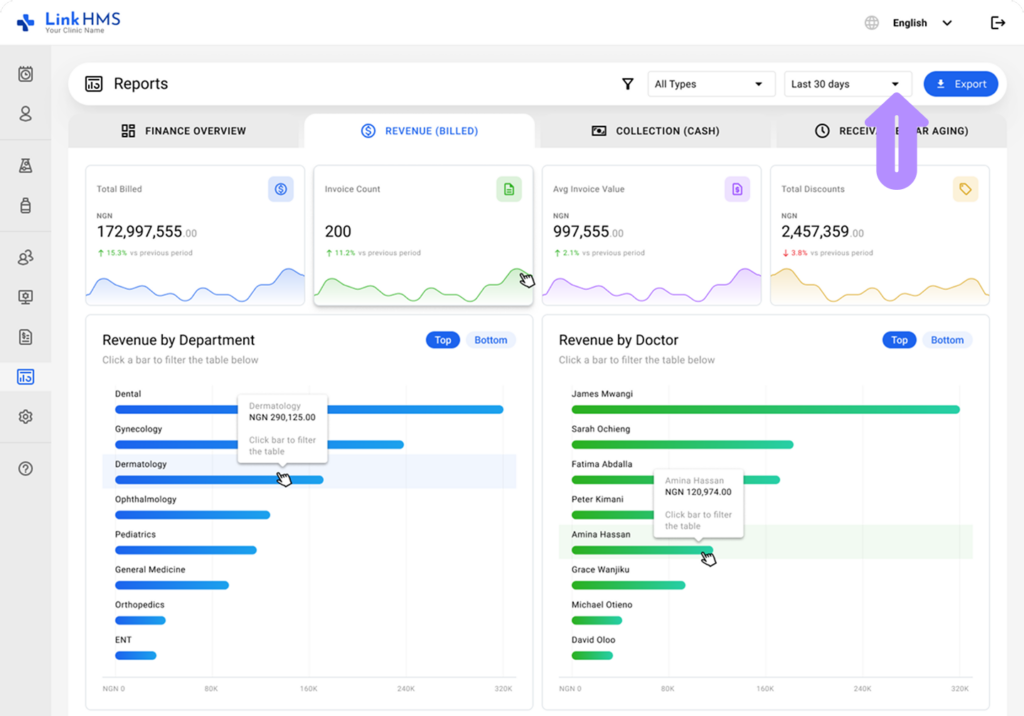
- Choose an activity type (All Types, Service, or Pharmacy) to view the corresponding distribution.
- See a brief summary of key revenue metrics, including
- Total Billed
- Invoice Count
- Avg Invoice Value
- Total Discounts (Coming soon)
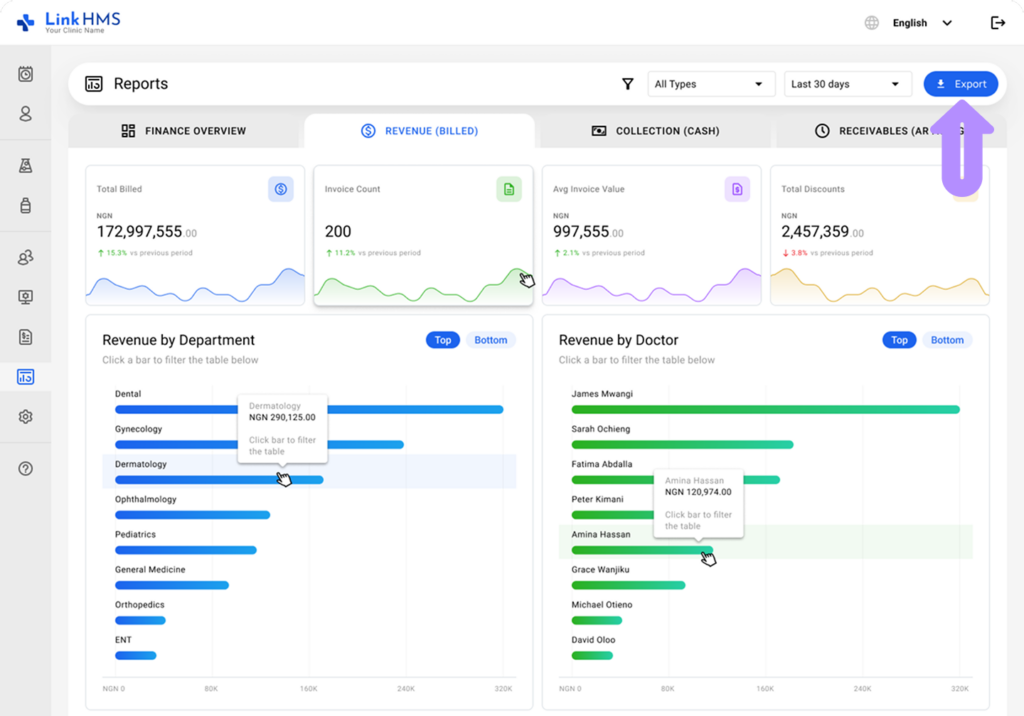
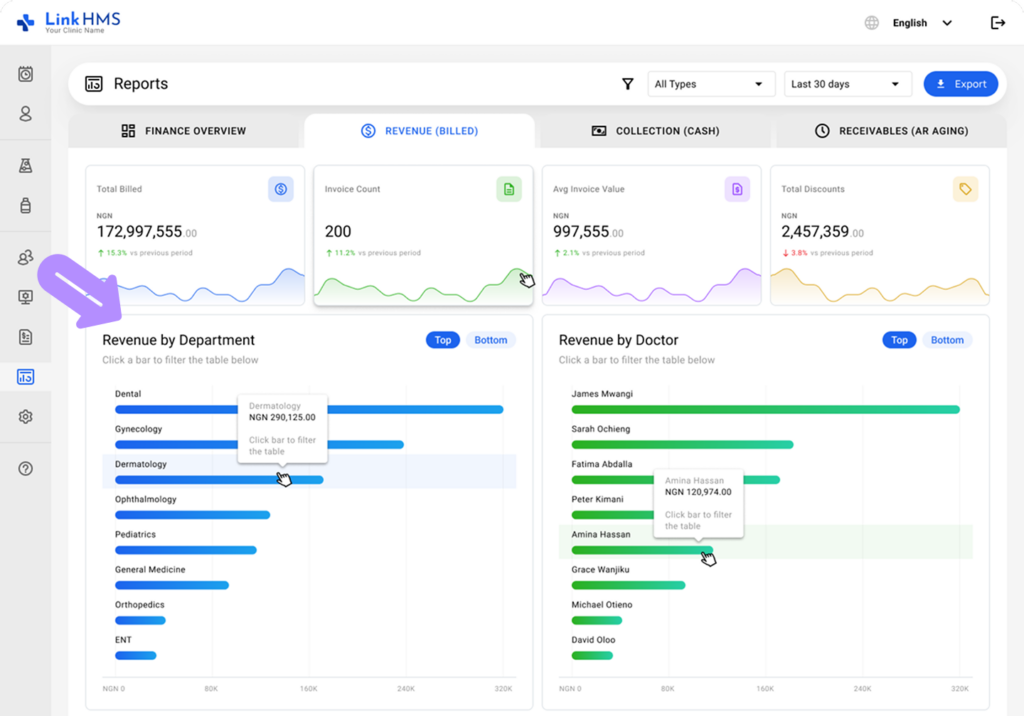
- View revenue by department, filter the table by clicking a bar, and switch between top- and bottom-performing departments.
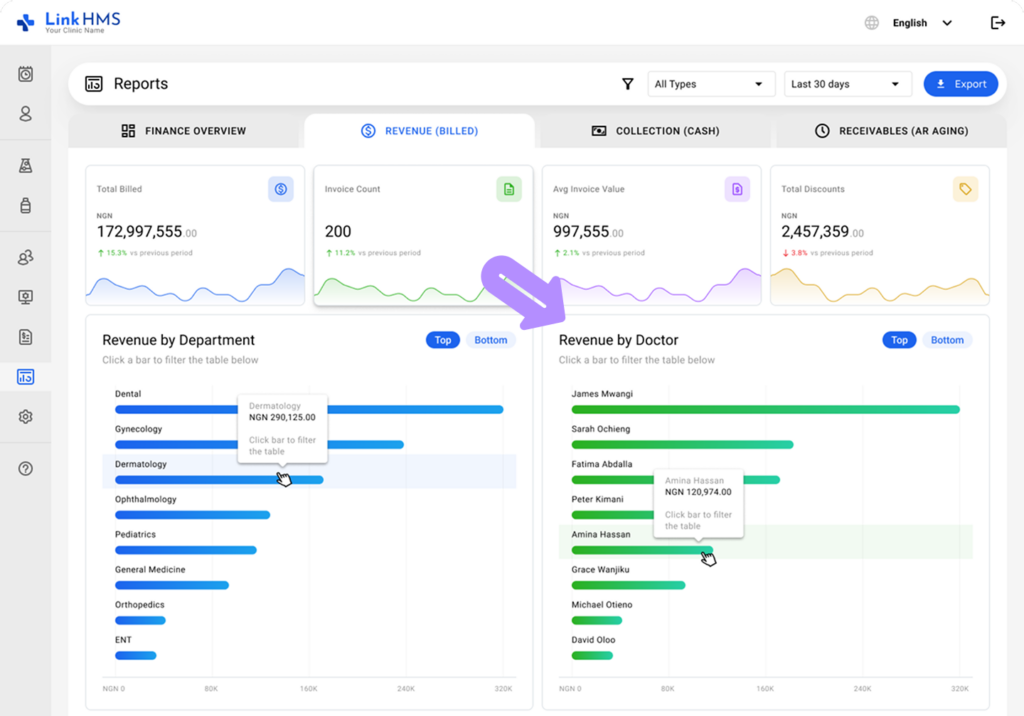
- Review revenue by doctor, select a chart bar to filter the table, and switch between top and bottom performers.
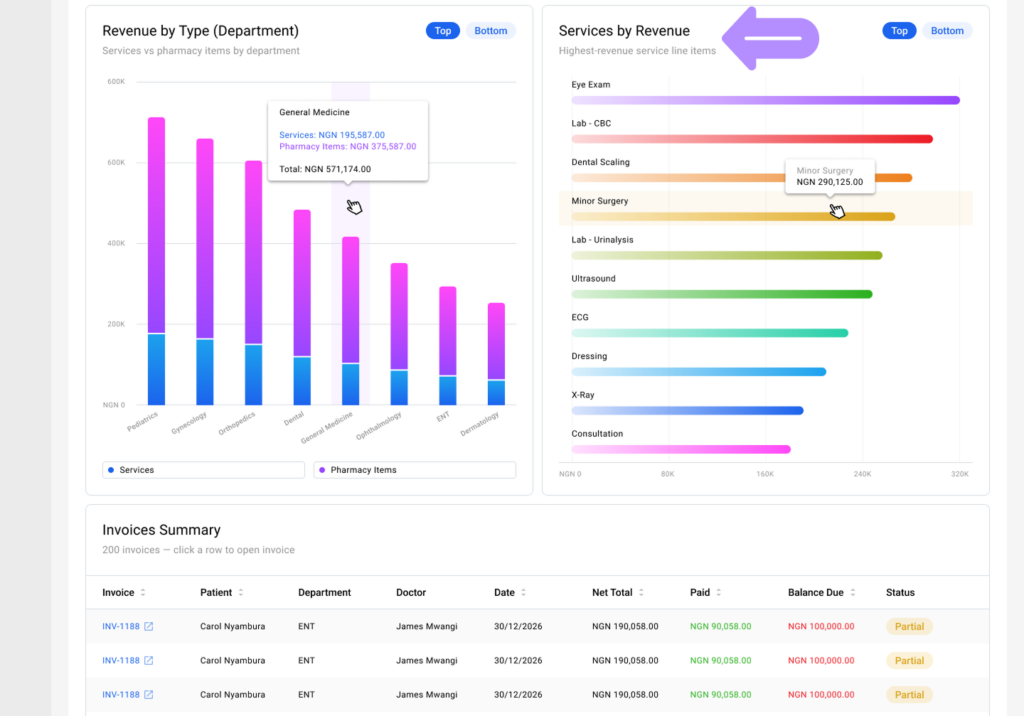
- Compare revenue by type (services vs pharmacy) across departments and view top or bottom results. (Coming soon)
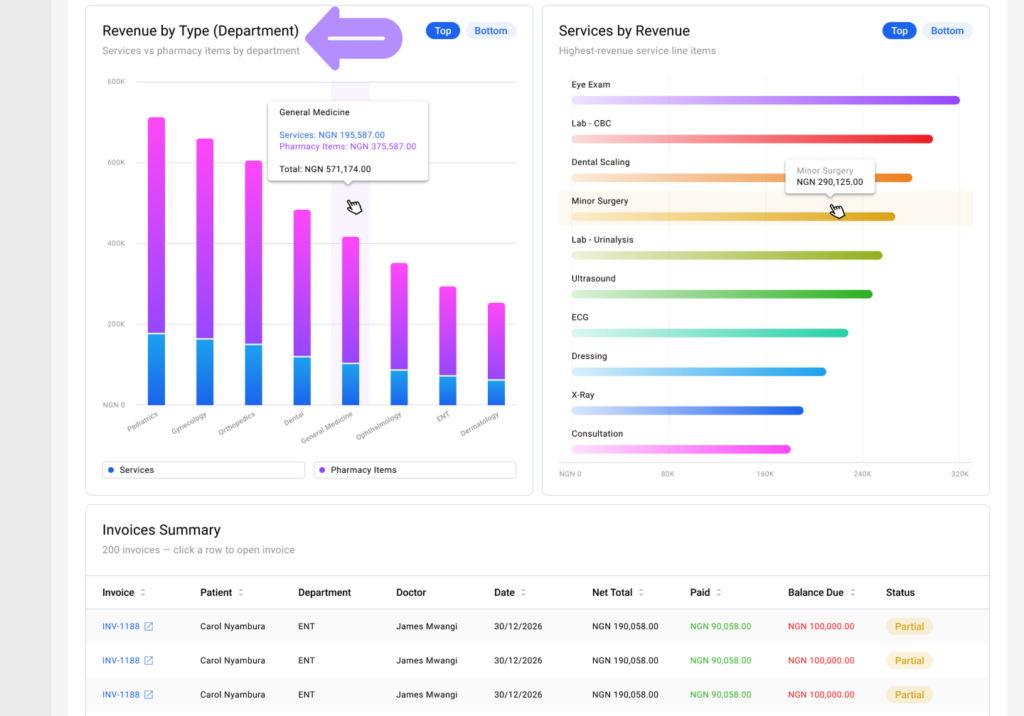
- Check the service revenue rankings to compare the top- and bottom-revenue-generating services. (Coming soon)
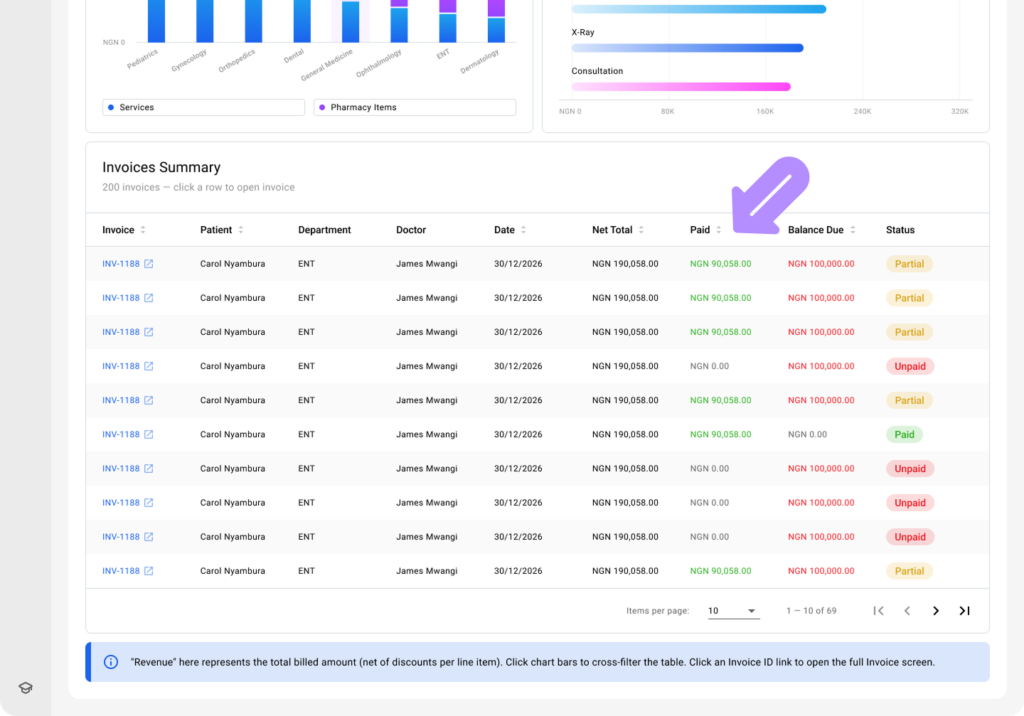
- Use the invoice summary table to review related details, including Invoice, Patient, Department, Doctor, Date, Net Total, Paid, Balance Due, and Status.
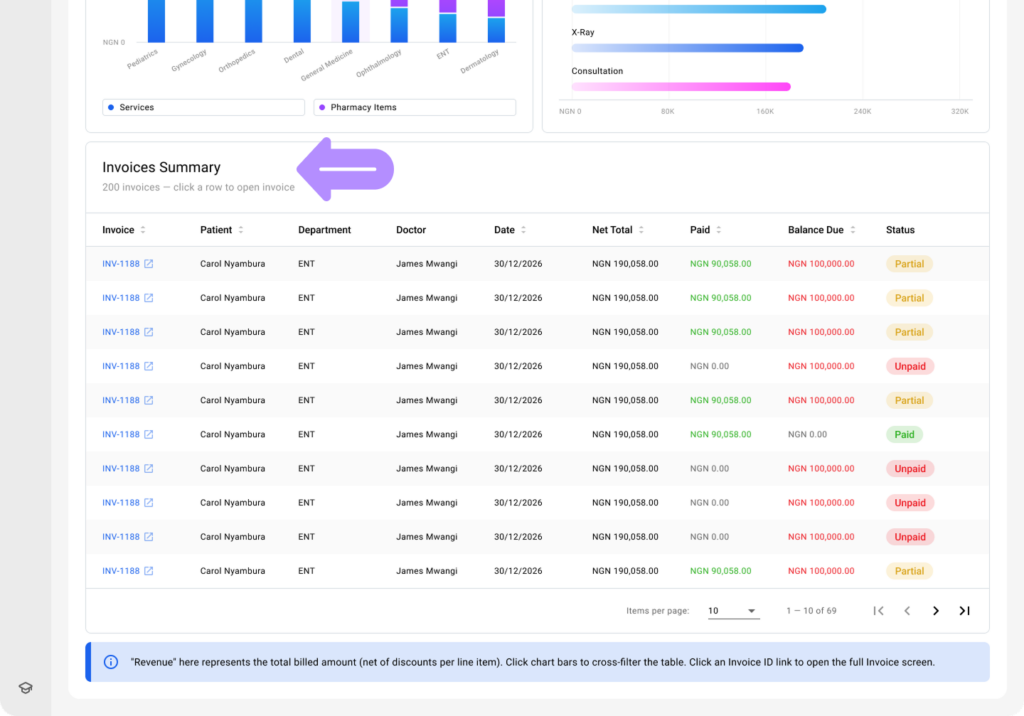
- Click a chart bar to filter the table, and click the required invoice to open the full info.
- Use the Export button at the top right to download the data. (Coming soon)